Setting up Munin on multiple nodes on EC2
If you are running a web service that is spread across multiple nodes on EC2, you should definitely setup some monitoring software as soon as possible. I like to use munin to monitor system-level performance metrics. Munin is easy to install, and it’s fairly easy to build your own plugins (in Python) to monitor any internal metrics (signups, logins, etc).
Unfortunately, there are not a lot of good tutorials helping out beginners on how to install munin from scratch on multiple nodes. I am aiming to bridge that gap with this post. I am assuming you are running UBUNTU 14.04 LTS (installing 3rd party software using apt-get). It is also very important that port 4949 is open for TCP, as this is how munin-nodes talk to the munin server. This can be setup using EC2 security groups.
Setting up Munin Nodes
The first step to installing munin is to update your apt-get package manager (you want the latest and greatest version of munin after all.):
sudo apt-get upgrade
sudo apt-get update
After everything is upgraded, you need to install munin and munin-node on all machines you want to monitor. It is important that one single machine is going to act as the munin-server, and it will monitor all of the munin nodes. If you want to monitor the machine that is acting as the munin server, it will also be a munin-node (that is what I am doing here). So with that said, on every machine in your web service run the following command:
sudo apt-get install -y munin munin-node munin-plugins-extra
Installing munin-plugins-extra is optional, but I always do it because there are a lot of useful plugins in that package (although not all of them are supported) Ok, munin node should be up and running on all of these machines now, you can see this by doing a grep on the processes:
web1:~$ ps aux | grep munin
root      9394  0.0  0.1  49948  8200 ?        Ss   May07  12:41 /usr/sbin/munin-node
Now that munin node is up and running, lets update the munin-node.conf on each of the machines. The munin-node.conf file needs to be configured to provide the name of the munin-node and the accepted ip-address(s) that are allowed talk to the munin-node process via TCP on port 4949 (default, but can be changed in this file). Here is an example of the munin-node.conf file (on UBUNTU, this file lives at /etc/munin/munin-node.conf).
1
2
3
4
5
6
7
8
9
10
11
12
13
14
15
16
17
18
19
20
21
22
23
24
25
26
27
28
29
30
31
32
33
34
35
36
37
38
39
40
41
42
43
44
45
46
47
48
49
50
51
52
53
54
55
#
# Example config-file for munin-node
#

log_level 4
log_file /var/log/munin/munin-node.log
pid_file /var/run/munin/munin-node.pid

background 1
setsid 1

user root
group root

# Regexps for files to ignore

ignore_file ~$
#ignore_file [#~]$  # FIX doesn't work. '#' starts a comment
ignore_file DEADJOE$
ignore_file \.bak$
ignore_file %$
ignore_file \.dpkg-(tmp|new|old|dist)$
ignore_file \.rpm(save|new)$
ignore_file \.pod$

# Set this if the client doesn't report the correct hostname when
# telnetting to localhost, port 4949
#
#host_name localhost.localdomain

# A list of addresses that are allowed to connect.  This must be a
# regular expression, since Net::Server does not understand CIDR-style
# network notation unless the perl module Net::CIDR is installed.  You
# may repeat the allow line as many times as you'd like

host_name database.mathandpencil.com
allow ^.*$

# If you have installed the Net::CIDR perl module, you can use one or more
# cidr_allow and cidr_deny address/mask patterns.  A connecting client must
# match any cidr_allow, and not match any cidr_deny.  Note that a netmask
# *must* be provided, even if it's /32
#
# Example:
#
# cidr_allow 127.0.0.1/32
# cidr_allow 192.0.2.0/24
# cidr_deny  192.0.2.42/32

# Which address to bind to;
host *
# host 127.0.0.1

# And which port
port 4949
The the only 2 lines in this file that I needed to update were 36+37. Here is where I am telling munin-node that the name of this node (this will show up in the munin graphs) is database.mathandpencil.com and the node should accept all ip addresses. It is important to note I am accepting all IP address because I have my security groups / and fire walls configured so only other computers within my security group can talk to this node. You do not want to have TCP on 4949 open to the world.
After you have updated munin-node.conf, you need to restart the process.
sudo service munin-node restart
Now you are done with this node. You need to do this on every node in your network, and you need to use unique host names for each node. Note, the host names do not have to actually have CNAMES associated with them, they are just for internal, munin usage.
Setting up the Munin Server
Now that you have the nodes configured, you need to setup a munin server, which will take all of the munin-node data, aggregate it in 5 minute intervals (via a cron job), and display it in a nice, graphical form. To do this you need to install NGINX to serve the static resoures + html, but first lets use telnet to make sure that your server can communicate with the nodes, as there will be no data to graph if it cannot.
Assuming I am logged in the my munin-server and want to test a munin-node that lives on 1.1.1.1, run the following command:
web1:~$ telnet 1.1.1.1 4949
Trying 1.1.1.1...
Connected to 1.1.1.1.
Escape character is '^]'.
# munin node at database.mathandpencil.com
It is important that you can telnet into your munin-nodes FROM your munin server (the instance that shows the graphs). You should NOT be able to telnet from your munin-nodes into your server. It is only a one-way relationship. If you get a reply with the node-name, you are good to go. If you have issues, make sure port 4949 is configured for TCP correct.
Now you need to update your munin server conf file. The munin server config file lives at /etc/munin/munin.conf. You need to add each of the munin nodes you are monitoring so munin config knows where to go grab the statistics from. The following is an example of my munin.conf:
1
2
3
4
5
6
7
8
9
includedir /etc/munin/munin-conf.d

[monitor.mathandpencil.com]
    address 127.0.0.1
    use_node_name no

[database.mathandpencil.com]
    address 1.1.1.1
    use_node_name no
sudo apt-get install nginx
Here is an example of an nginx configuration file I used on my munin server:
1
2
3
4
5
6
7
8
9
10
11
12
13
14
15
16
17
18
19
server {

	listen 80;
	client_max_body_size 4M;
	server_name _;

	location /munin/ {
		auth_basic  "Restricted";
		auth_basic_user_file  /home/ubuntu/.htpasswd;
		alias /var/cache/munin/www/;
		expires modified +310s;
	}

    location /nginx_status {
      stub_status   on;
      access_log    off;
      allow 127.0.0.1;
    }
}
Lines 7-11 setup the munin graphs. I like my munin graphs to live at http://www.mathandpencil.com/munin/, but it is up to you. Also, I recommend adding authenication to munin, as you do not want any bloak with internet access to see your web service metrics.
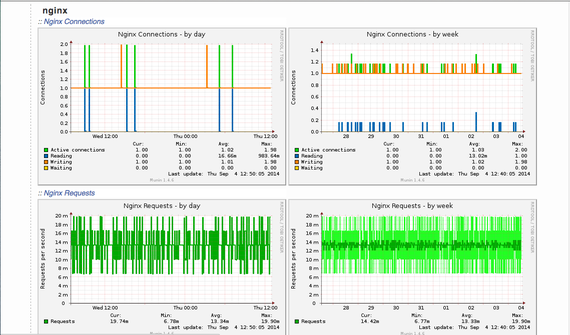
Lines 14-17 are actually added so munin can monitor NGINX so if that is something you are interested in, you should definitely add those also.
Now, restart NGINX and wait 5 minutes for the cron job to run and you should see something like the following:
Installing/Deleting New Plugins
Up to this point, the only plugins that are installed are the system level plugins that come with munin. You are going to probably want to use addtional plugins to monitor your services (Postgres, MYSQL, Mongo, Redis, etc.)
To install and delete plugins, you need to look at two separate directories:
/usr/share/munin/plugins/ is where all of the plugins live, but they are not necessarily installed. To install a plugin you need to add a symlink from /usr/share/munin/plugins/ to /etc/munin/plugins/. I wish I could tell you that installing the 3rd party plugins that come with munin-plugins-extra is easy, but it is definitely hit-or-miss. I am not going to write anything about how to debug the specific plugins, as you can google that for yourself (good luck, it sucks), but I can tell you a few things to watch out for:
1) Make sure ALL plugins have execute permissions!!! (sudo chmod +x PLUGIN)
2) To see which plugins are currently installed, you can run the following command:
sudo munin-node-configure --suggest
and you will see something like the following output:
web1:~$ sudo munin-node-configure --suggest
Plugin                     | Used | Suggestions
------                     | ---- | -----------
acpi                       | no   | no [cannot read /proc/acpi/thermal_zone/*/temperature]
amavis                     | no   | no
apache_accesses            | no   | no [apache server-status not found. check if mod_status is enabled]
apache_processes           | no   | no
apache_volume              | no   | no [apache server-status not found. check if mod_status is enabled]
apc_envunit_               | no   | no [no units to monitor]
bonding_err_               | no   | no [No /proc/net/bonding]
courier_mta_mailqueue      | no   | no [spooldir not found]
courier_mta_mailstats      | no   | no [could not find executable]
courier_mta_mailvolume     | no   | no [could not find executable]
cps_                       | no   | no
cpu                        | yes  | yes
cpuspeed                   | no   | no [missing /sys/devices/system/cpu/cpu0/cpufreq/stats/time_in_state]
cupsys_pages               | no   | no [could not find logdir]
df                         | yes  | yes
df_inode                   | yes  | yes
diskstats                  | yes  | yes
entropy                    | yes  | yes
exim_mailqueue             | no   | no [no exiqgrep]
exim_mailstats             | no   | no [logdir does not exist]
fail2ban                   | no   | no [/usr/bin/fail2ban-client not found]
forks                      | yes  | yes
fw_conntrack               | no   | no
fw_forwarded_local         | no   | no [/proc/net/ip_conntrack missing or not readable]
fw_packets                 | yes  | yes
3) To see which plugins munin thinks are configured correctly and are ready to go, run the following command:
sudo /usr/sbin/munin-node-configure --shell
and you will see something like the following output:
ln -s '/usr/share/munin/plugins/postgres_autovacuum' '/etc/munin/plugins/postgres_autovacuum'
ln -s '/usr/share/munin/plugins/postgres_bgwriter' '/etc/munin/plugins/postgres_bgwriter'
ln -s '/usr/share/munin/plugins/postgres_cache_' '/etc/munin/plugins/postgres_cache_ALL'
ln -s '/usr/share/munin/plugins/postgres_cache_' '/etc/munin/plugins/postgres_cache_trades_db'
ln -s '/usr/share/munin/plugins/postgres_checkpoints' '/etc/munin/plugins/postgres_checkpoints'
ln -s '/usr/share/munin/plugins/postgres_connections_' '/etc/munin/plugins/postgres_connections_ALL'
ln -s '/usr/share/munin/plugins/postgres_connections_' '/etc/munin/plugins/postgres_connections_trades_db'
ln -s '/usr/share/munin/plugins/postgres_connections_db' '/etc/munin/plugins/postgres_connections_db'
ln -s '/usr/share/munin/plugins/postgres_locks_' '/etc/munin/plugins/postgres_locks_ALL'
ln -s '/usr/share/munin/plugins/postgres_locks_' '/etc/munin/plugins/postgres_locks_trades_db'
ln -s '/usr/share/munin/plugins/postgres_querylength_' '/etc/munin/plugins/postgres_querylength_ALL'
ln -s '/usr/share/munin/plugins/postgres_querylength_' '/etc/munin/plugins/postgres_querylength_trades_db'
ln -s '/usr/share/munin/plugins/postgres_scans_' '/etc/munin/plugins/postgres_scans_trades_db'
ln -s '/usr/share/munin/plugins/postgres_size_' '/etc/munin/plugins/postgres_size_ALL'
ln -s '/usr/share/munin/plugins/postgres_size_' '/etc/munin/plugins/postgres_size_trades_db'
ln -s '/usr/share/munin/plugins/postgres_transactions_' '/etc/munin/plugins/postgres_transactions_ALL'
ln -s '/usr/share/munin/plugins/postgres_transactions_' '/etc/munin/plugins/postgres_transactions_trades_db'
ln -s '/usr/share/munin/plugins/postgres_tuples_' '/etc/munin/plugins/postgres_tuples_trades_db'
ln -s '/usr/share/munin/plugins/postgres_users' '/etc/munin/plugins/postgres_users'
ln -s '/usr/share/munin/plugins/postgres_xlog' '/etc/munin/plugins/postgres_xlog'
As you can see, my postgres plugins are configured correctly and munin has auto-generated the symlinks for me. If I execute these commands all of my postgres plugins will now be installed, and in about 5 minutes, the graphs will show up on the munin server
4) To test an individual plugin, you can run the following command (from within /etc/munin/plugins/):
web1:~$ sudo munin-run cpu
user.value 11422573
nice.value 18233859
system.value 14602804
idle.value 2395193472
iowait.value 1969520
irq.value 47
softirq.value 36488
steal.value 9676317
As you can see from the output, my cpu plugin is running just fine and returning values.
To delete a plugin (and the graph), just simply delete the symlink and it will drop out next time the cron job runs.
That’s it! That should get you up-and-running pretty quickly. As always, if you have any questions/comments please send me a pull request on github. If you are interested in sys-admin, machine learning, math, and/or statistics you can following me on twitter: @josephmisiti